Finance Report: 2022

Paula McGinnell
Welcome to our Ecologi finance report for January – December 2022.
Trust is a core value at Ecologi and as a result, we want to provide ongoing visibility to our customers on the flow of funds and the company’s financial operations.
We are moving from quarterly updates to annual updates so we can provide you with a more robust and clear financial update about Ecologi’s full calendar year.
Climate Impact
Between January and December 2022, our subscribers funded the planting of 25,984,490 trees and 1,280,579 tonnes of carbon avoidance. Between 2021-22, there was an increase of 40%+ in the cost of trees on our platform. This new price reflected a strategic decision to connect with more reforestation partners around the world and support exciting new techniques and project locations.
Please see graphs below for the breakdown of cumulative trees funded and cumulative avoidance funded (tCO2e).


You can see our full impact in our Public Ledger, and find out more detail about the projects we have funded here.
Revenue
Revenue consists of the total proceeds from our customer base. Total recognised revenue for calendar year 2022 was £12.2m, which is 84% YoY growth from 2021 as shown in the graph below.

The revenue split 2019 – 2022 is shown on the graphs below.
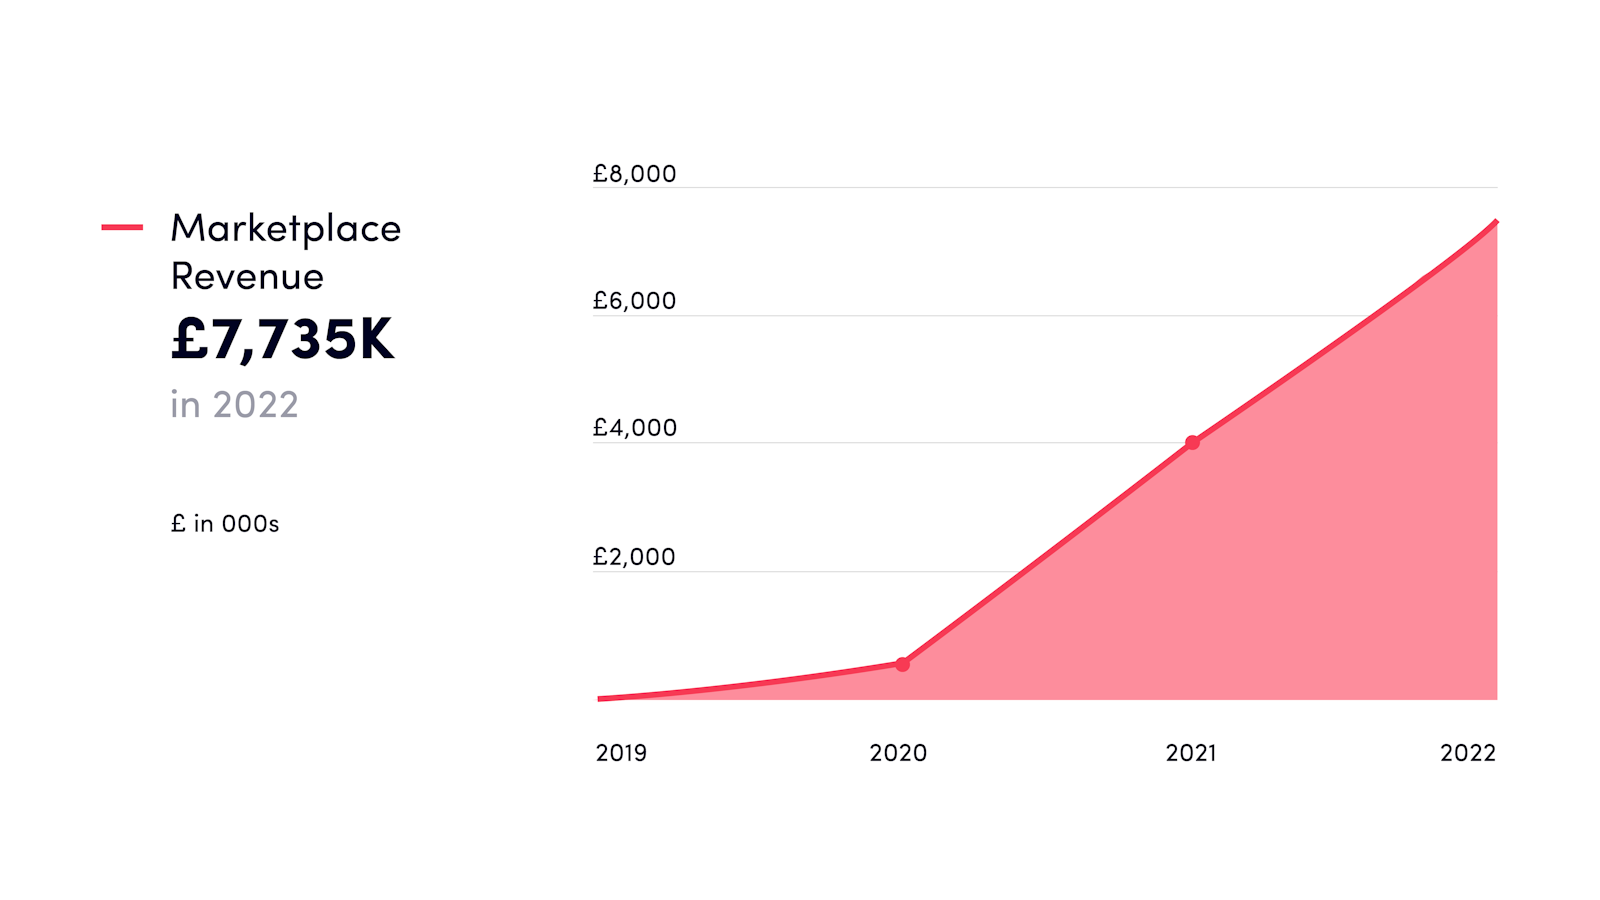
Marketplace represents revenue from our Impact Shop, API integrations, and gifts, and is supported by self-serve and assisted sales. We launched our Impact shop in 2022 which has contributed to the increase in revenue as it enables customers to support a wide range of projects. More information can be found here.

Climate Action Workforce (CAW), formally known as Climate Positive Workforce, represents revenue from our business subscribers. CAW revenue has been growing steadily due to larger customer sign ups.

Climate Positive Individual (CPI) represents revenue from our individual subscribers. We are letting the individual customer side grow organically which allows the company to focus our marketing budget and resources on the B2B (business to business) activity.
Gross margin
Gross margin is the portion of the company’s revenue left over after cost of sales are subtracted. Our cost of sales include our purchase of trees and carbon, and transaction costs. The below graph shows Ecologi’s average gross margin from 2019 to 2022. The increase in 2022 is due to increasing the mix of B2B vs B2C revenue given our focus on the B2B market.

Expenditure
Our total cost of sales for 2022 was £9,745,208. Our operating expenses were £7,036,864. Operating expenses include staffing costs, marketing costs, and internal IT and platform costs.
The graph below shows the expenditure split 2019 – 2022.

The increase in operating expenses in 2022 is largely due to the development of Ecologi Zero, a highly requested product incubated by Ecologi which offers automated carbon accounting for businesses under a freemium model. Following this period of development we are excited that the premium version of this product will be launched in late 2023.
EBITDA (Earnings Before Interest, Taxes, Depreciation, and Amortisation)
EBITDA is a measure of profitability for companies. Ecologi’s EBITDA for 2022 was (£4,573,642). This is reflective of the strategic decisions we made to invest in, particularly, Ecologi Zero upfront. The launch of this SaaS product is expected to play a pivotal role in both improving Ecologi’s margins & future revenue, as well as remaining a leader in enabling simple climate action for businesses. In 2023, Ecologi is making operational improvements, cost optimisations and margin improvements that will result in lower costs and higher EBITDA for the year.

Read more
You can find out more about our finances and operations in our quarterly financial reports located in our Public Impact Ledger and our 2022 Impact report.


